Frank Pattyn on the Importance of Studying the Surface Mass Balance of the Antarctic Ice Sheet
Frank Pattyn in a Belgian glaciologist and ice sheet modeller. He is the director of the Laboratoire de Glaciologie at the Université Libre de Bruxelles (ULB). Professor Pattyn has developed many ice sheet models, such as the Blatter-Pattyn model (a three-dimensional thermomechanical ice sheet model including higher-order stress gradients) and more recently the fast Elementary Thermomechanical Ice Sheet model (f.ETISh). These models simulate the behaviour of ice sheets and ice shelves, and allow for projecting future mass changes of ice sheets.
Professor Pattyn is currently Chairman of the Belgian National Committee on Antarctic Research, the Belgian branch of SCAR, the Scientific Committee on Antarctic Research. He is also vice-president of the International Glaciological Society and Associate Chief Editor of the Journal of Glaciology. He has also taken part in nineteen expeditions to study Arctic and Antarctic glaciers.
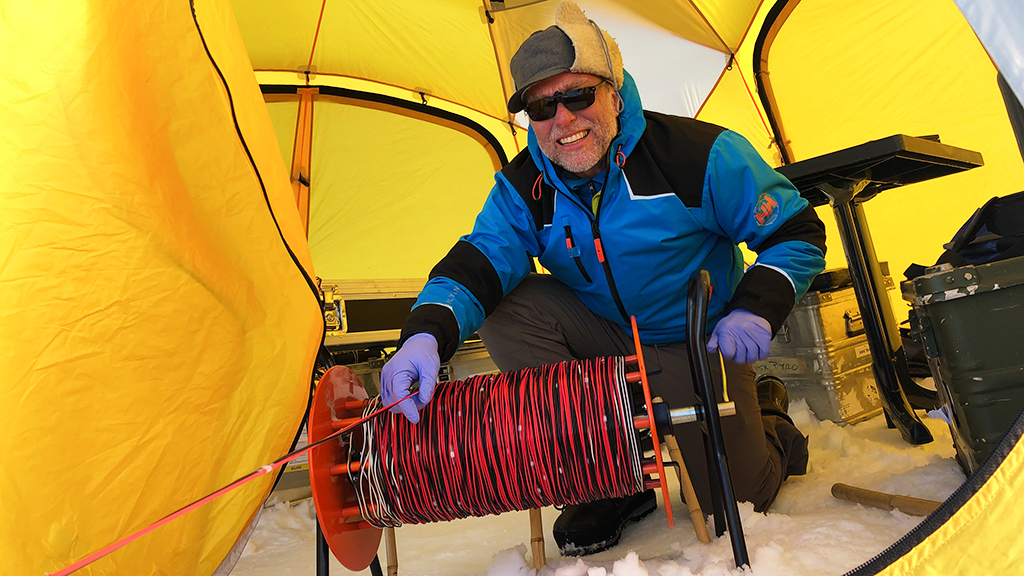
During the 2019-2020 BELARE season he travelled to the Princess Elisabeth Antarctica Research Station with the Mass2Ant project team for the final season of that project, an experience he has recounted. While not being a project PI, he was involved with the research during the 2019-2020 season.
What has the MASS2ANT project been studying in the Princess Ragnhild Coast region of East Antarctica?
The Mass2Ant project focused on temperature increases that we have observed over the last few centuries and associated changes in surface mass balance of the Antarctic Ice Sheet. Most of the mass balance of the Antarctic Ice Sheet is influenced by precipitation brought from across the Southern Ocean.
During previous seasons at PEA, the Mass2Ant team conducted two drillings in ice rises to complement the one which had already been carried out in the past for another project. Now, in three of these ice rises we have a record of how mass balance and snow accumulation changed over a period of more than one hundred years.
What were your objectives this past season?
My main objective was to close the project this year by carrying out repeat measurements, and we did so very efficiently. We had only one day of bad weather, which was very lucky.
What is behind the differences in surface mass balance across the Antarctica? Why is it important to study surface mass balance?
There are many places where surface mass balance is directly measured. The most obvious way to do so is by drilling a core and then analysing the thickness of the different layers. That gives you a year-to-year variability of snow accumulation. We further analyse isotopes of hydrogen and oxygen in the water molecules. The isotopes give you the yearly cycle in temperature so you can precisely date each of these layers to determine how much has been deposited every year.
We had done that with the first ice cores we drilled, and we saw that over the last couple of decades, there has been an increasing in mass balance along the Princes Ragnhild Coast in East Antarctica. This is a surprising trend, as it was not seen in other ice cores in other parts of Antarctica. One of the hypotheses we put forward was that this was due to the fact that the area where we extracted the ice cores was much closer to the ocean, where you can see higher rates of snowfall. The amount of snowfall on a given area depends on how far a weather system can penetrate inland. Therefore, variability in weather patterns is probably related to the variability that we can detect in the ice cores we extracted.
Besides extracting ice cores and taking surface mass balance measurements of snow and ice, the Mass2Ant team also placed automatic weather stations on ice rises near the coast. How do the data these weather stations collect complement the project?
When you drill ice cores, this helps you to travel back into the past. But in order to get the whole picture, you also need to understand the different processes that are responsible for the distribution of ice and snow in the region.
In Belgium, for instance, whenever it rains or snows, the precipitation usually stays more or less in one place. This isn’t the case in Antarctica, where wind plays a major role in redistributing fallen snow. So, if you drill an ice core in a certain place, it does not necessarily mean that you’ll be able to measure precipitation in that spot. The snow could also have been deposited there by the wind. There is a risk of underestimating or overestimating snowfall in a particular place. So, in order to understand those processes, we installed two weather stations to understand how much snow arrives in that spot due to the wind and how local meteorological parameters influence this deposition.
Why is it important to study small-scale climate processes occurring in the Southern Hemisphere? What impacts could they have on large-scale events?
Upscaling is quite important. This is also a big part of the work of the Mass2Ant project. The idea is to see whether local variabilities are also detectable in larger atmospheric models. They translate local information to a larger scale, which allows us to understand how the surface mass balance of the whole Antarctic Ice Sheet functions.
During the 2018-2019 season in Antarctica, MASS2ANT extracted ice cores at the coast drilled to a depth of 260 metres. Have you been able to analyse these cores and learn anything from them?
Two ice cores were drilled. One during the 2017-2018 season, and one during the 2018-2019 setons, which was led by Professor Jean-Louis Tison and included Sarah Wauthy, who is in the process of analysing the ice cores at the ULB.
There are different types of analyses that Sarah will conduct. I already mentioned looking at the hydrogen and oxygen isotopes in the ice molecules, which allow you to determine the local temperature variations. It furthermore helps you to date the ice layers in the ice core.
But there is also the analysis of the density of the ice, the thickness of the layers, and eventually the analysis of other elements and gas, which allows you to identify and link these two variations in the sea-ice extension.
But the fact is that if you want to accurately interpret the ice cores, then you must also take into account ice-dynamical aspects. When ice accumulates every year, it also stretches. The reason why it happens is because the ice sheet on which the snow falls every year is moving. It moves not towards the centre, but sideways, out towards the coasts of the continent. And it means that the deeper you go, the more you find that the layers of ice have been stretched.
The ice layers in the ice sheet are like a rubber band: they get thinner when they’re stretched. So if you measure the thickness of the rubber band when it’s stretched, you actually underestimate its initial thickness. In the same way, there’s a risk of underestimating the amount of precipitation and snow accumulation with regard to the ice sheet’s mass balance. So what we need to do is to understand how this thinning process works.
How can one avoid underestimating mass balance?
A way to do so is by taking repeat measurements, preferably a year apart. This means that you need to do a measurement one year and then the following year you need to do exactly the same measurement in the same place. This allows you to measure how layers are stretched over time. There are several methods one can use.
One method is the optical televiewer. You lower a camera in the ice core borehole, and it takes 360° images as we lower it into the borehole. By processing the data, you are able to have a complete cylindrical 3D view of the ice core, which allows you to detect several layers in the hole corresponding to each year of snow accumulation.
You can distinguish individual years due to melting and refreezing at the surface that occurs with the seasons. Melting that occurs in summer makes the ice layers become denser and darker, while in winter, there is more accumulation and so the ice layers are less dense but whiter. If we compare these layers year-to-year, we can quantify how much stretching and thinning of each ice layer occurs over a year.
It’s also possible to use radar to quantify how ice layers are stretched and thinned. The radar emits electro-magnetic signals that penetrate the ice but bounce off of impurity layers in the ice. These impurities can be volcanic ashes but also icy layers or variations in ice density. The bottom of the ice, where it meets the bedrock, is the brightest reflector. Therefore, ice radar is often used to determine the thickness of the ice. However, if you have impurities in the ice, they show up as little wiggles in your radar image. You can then compare the wiggles of one year with the ones you obtained the following year-end this helps you determine how the ice layers change over time.
And then there is a new method I have tried this past season. I employed the same radar but with varying antenna orientations. This method is interesting because ice crystals are not aligned in the same direction and the radar signal bounces off differently depending on the orientation of each crystal. This crystal orientation is a function of how ice deforms, or to put it differently how the rubber band stretches. So we can determine changes in ice crystals orientation by changing the angles of our antennas.
Other members of the Mass2Ant team (from the Delft University of Technology and the University of Colorado Boulder) employed a snow micropen, which is kind of a needle that goes through the surface. If you constantly force the needle, then the way it penetrates the ice is a function of how dense the layer is. They used this method to get information about how ice layer density changes over time. The results still need to be analysed, but we can already tell that there is a huge amount of surface variability.
How will the findings of the MASS2ANT project contribute to future climate change projections? How will they contribute to future IPCC reports?
The major contribution of this project lies in improving the predicted behaviour of climate models and more precisely, the surface mass balance and the distribution of snow accumulation. This is possible in many ways. First of all, now we have direct measurements thanks to the ice core analysis and weather stations, and we can understand the processes that can link and compare the different models. We can see how well models are able to resolve small-scale variability, whether it is regional variability, temporal variability, etc.
The work of the project also helps to understand current and recent past surface mass balance of the Antarctic Ice Sheet over the last couple of decades. Most of this analysis is done by regional climate models to determine the surface mass balance, which can be validated against our ice core evidence. Finally, we also have a better understanding of the processes that are involved in surface mass balance, especially with respect how it is re-distributed across the surface of the Antarctic Ice Sheet.
What kind of logistical support did you receive during your three seasons in Antarctica? How did it help the project?
This was the third expedition of the Mass2ant and the main difference with the previous ones is that it was logistically much lighter. There was no drilling involved. In terms of equipment, this year we only brought radars, GPS instruments the optical televiewer and a snow micropen. So our team only consisted of a field guide from PEA and three scientists, which allowed us to travel swiftly.
We first went to the Western Ice Rise, put up small tents next to the borehole that had been done there last season to do all the measurements, and then headed to the second ice-rise to analyse that one. We only needed just over two intense and efficient weeks in the field to complete the work on the two sites. The organisation of and support for the field-campaign was excellent.
What are the next steps for your team of glaciologists at the ULB? Will there be future expeditions to Antarctica?
This was the last expedition of the Mass2Ant project and the remainder of the project will be dedicated to analysis of the different measurements and ice cores. For the moment there are no additional projects planned. There are calls for new projects coming up and wd are in the process of submitting a new proposal, but I cannot say much more about it now.
Let’s say that my interest is about the interaction between the ice and the ocean and this is something I am keen to discover more.